


The Trigonometry of a Sine Graph
The graph of a sine function is periodic. It creates a sine wave or sinusoid, a mathematical curve that describes a smooth continuous periodic oscillation.
Period function of sine (x + π) for all x from −π to π:
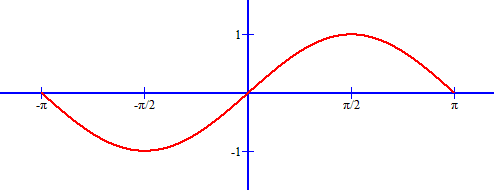
Examining the sine function graph (directly above) we can see the positive x-axis values π/2 and π. These values are equivalent fractions of 1/2 π and 2/2 π. By extending the sinusoidal oscillation beyond π we would see 3/2 π, 4/2 π (as 2π), 5/2 π, 6/2 π (as 3π) and so on. This same sine function behavior can also be shown for negative x-axis values as −1/2 π, −π, −3/2 π, −2 π and so on.
- −360° = −4/2 π radians
- −270° = −3/2 π radians
- −180° = −2/2 π radians
- −90° = −1/2 π radians
- 90° = 1/2 π radians
- 180° = 2/2 π radians
- 270° = 3/2 π radians
- 360° = 4/2 π radians
This proportionality extends beyond −2π and 2π radians. It also shows us that a sinusoidal period is described by 2π radians.
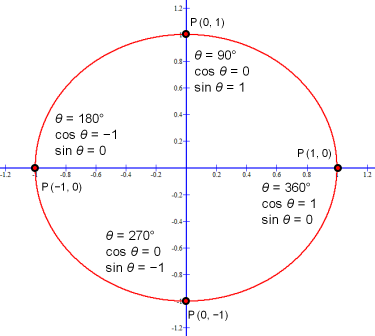
To understand proportionality beyond 2π consider a 390° angle θ on a unit circle. This angle can be described as 30° + 360° or as π/6 + 2π radians. The sine of 30°, sine π/6, is 1/2 and the sine of 30° + 360°, sine (π/6 + 2π), is also 1/2. From this observation and because the coordinates of a point, P, for a central angle are (cos θ, sin θ), P = (cos θ, sin θ), we can state:
- sin (θ + 2π) = sin θ
- cos (θ + 2π) = cos θ
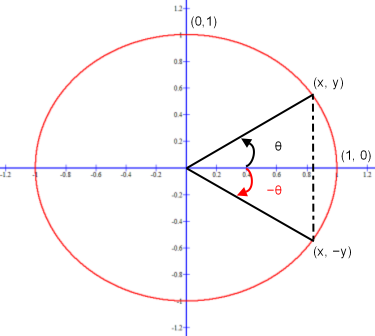
The sine is an odd function. The points on a unit circle corresponding to θ and −θ have y coordinates that are the additive inverse of each other. It means that for all values of θ for 0 ≤ θ ≤ π, −θ satisfies −π ≤ −θ ≤ 0. Because each y-coordinate is the sine of an angle, the sin (−θ) = −sin θ, for every θ. As an example, sin (−π/6) = −sin π/6 = −1/2.
y-coordinates of θ and −θ are additive inverses of each other:
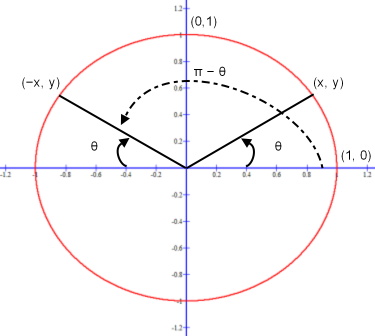
Once a sine θ graph is drawn for the interval 0 ≤ θ ≤ π/2, corresponding to a unit circle’s first quadrant, it is easy to extend the graph to the sin θ = y/1 = sin (π − θ). The sin (π − θ) is the supplement of sin θ. As an example, the sin π/6 = π − π/6 = 1/2 or, using degrees instead of radians, sin 30° = sin (180° − 30°) = 1/2. In fact, this relationship holds true for all values of θ.
sin θ = y/1 = sin (π − θ):
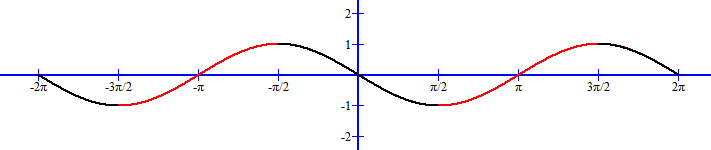
As an observation, the sine is an increasing function for 0 ≤ θ ≤ π/2 and is a decreasing function for π/2 ≤ θ ≤ π.
Sine function graph showing oscillations of increasing (red line) and decreasing (black line) wave behavior:
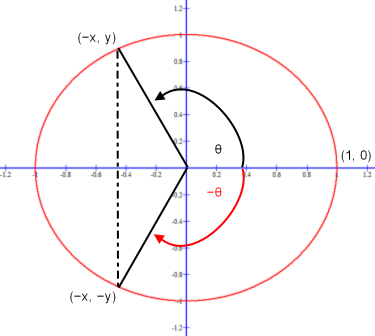
It has been shown that sin θ = sin (π − θ) when 0 ≤ θ ≤ π, now consider that the −sin θ = sin (π + θ) when π ≤ θ ≤ 2π. This then covers an entire sine period where 0 ≤ θ ≤ π for positive y-coordinate values and π ≤ θ ≤ 2π for negative y-coordinate values.
Copyright © DigitMath.com
All Rights Reserved.