


The Trigonometry of a Cosine Graph
The graph of a cosine function is periodic with period 2π and is similar to a graph of the sine function, with the difference that cosine function is shifted π/2 units left of the sine function for every corresponding value.
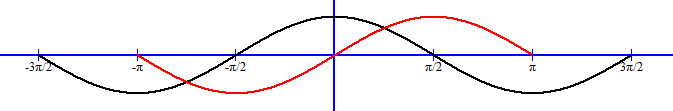
Period function of cosine and sine (red line) showing π/2 radian units shift:
To understand this π/2 radian units shift we equate five different degree measurements of cosine to sine:
- cos 0° = 1 = sin 90° = sin (0 + 90)°
- cos 30° = √3 / 2 = sin 60° = sin 120° = sin (30 + 90)°
- cos 45° = √2 / 2 = sin 45° = sin 135° = sin (45 + 90)°
- cos 60° = ½ = sin 30° = sin 150° = sin (60 + 90)°
- cos 90° = 0 = sin 180° = sin (90 + 90)°
Observe that in each value of corresponding cosine values equated to sine values that:
cos A° = sin (A + 90)°
or, in radian measure,
cos θ = sin (θ + π / 2)
… and it is this relationship that allows us to draw the cosine graph by shifting the sine graph by π/2 units to the left.
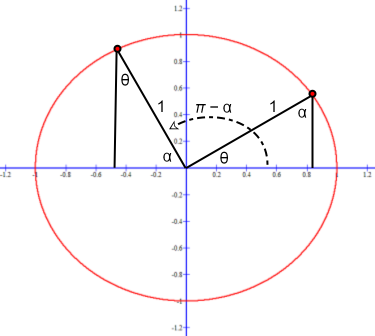
The π/2 shift of sine that equates the sine graph to the cosine graph can also be shown on a unit circle.
This unit circle shows the cos θ = sin α = sin (π − α) = sin (θ + π / 2):
 Top of Page
Copyright © DigitMath.com
All Rights Reserved.